Started By
Message

SOGa+ Top 25/SEC Rankings & weekend game picks
Posted on 11/1/24 at 11:54 am
Posted on 11/1/24 at 11:54 am


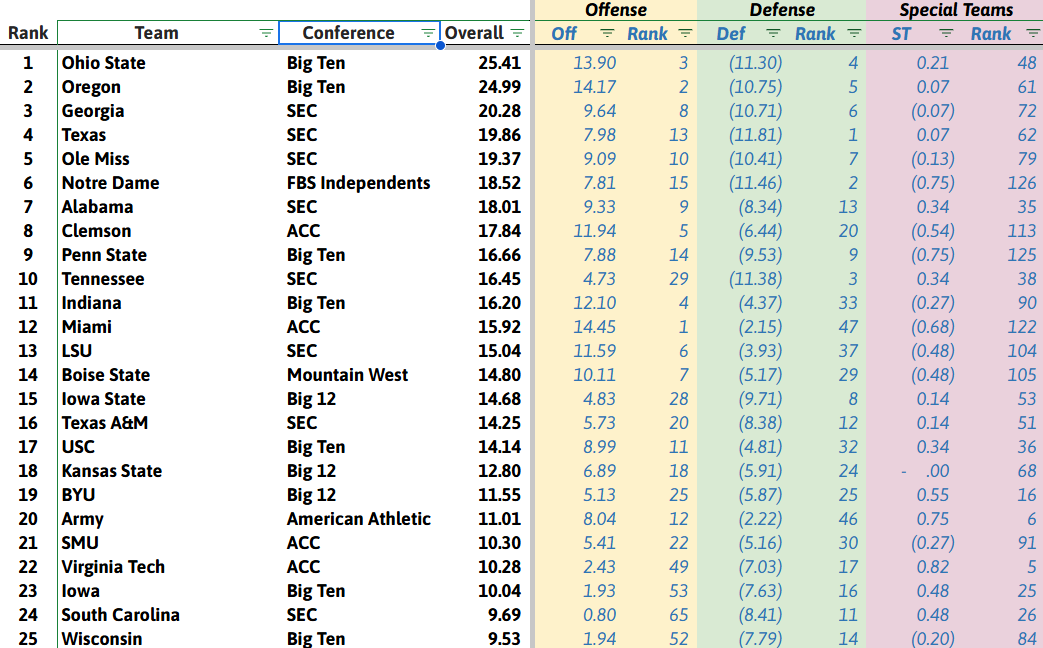
This is about as close as rankings like this have been between the top and the lower 1/3 of the Top 25 in a decade. For instance, if Ohio State (#1) played at Texas A&M (#16) they'd only be a 8 pt favorite.
Home field advantage would swing the favorite for games between basically #3 down to #15. That's how close all these teams are.
Ole Miss - 30
Arkansas - 21
Auburn - 29
Vanderbilt - 25
Georgia - 33
Florida - 21
Mississippi State - 43
UMass - 25
Texas A&M - 23
South Carolina - 20
Tennessee - 29
Kentucky - 13
Posted on 11/1/24 at 11:56 am to SummerOfGeorge
quote:
13 LSU
quote:
16 Texas A&M

Posted on 11/1/24 at 12:01 pm to FootballFrenzy
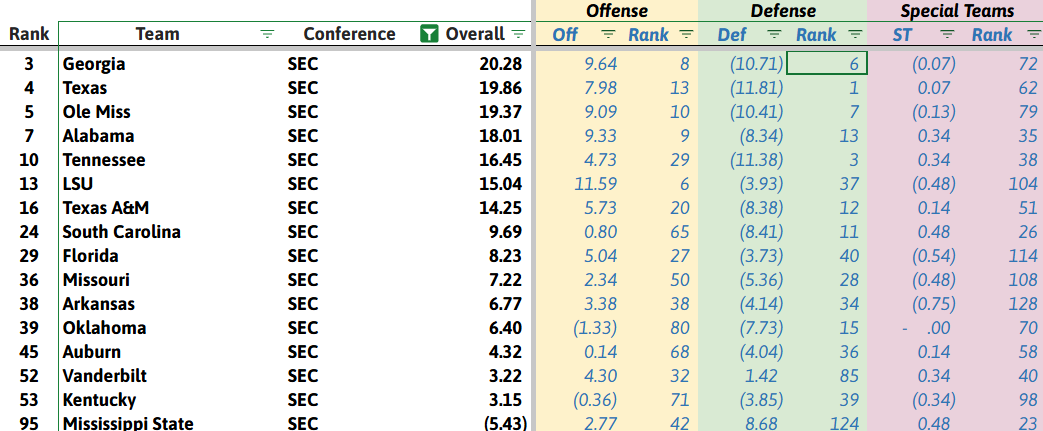
LSU and A&M are less than 1 point different than each other (+15.04 vs +14.25). Playing at home matters quite a bit.
Posted on 11/1/24 at 12:03 pm to SummerOfGeorge
I guess this just goes to show stats are sometimes bullshite.
Nevertheless, appreciate all of the hard work and the interesting results. Keep it up, man.
Nevertheless, appreciate all of the hard work and the interesting results. Keep it up, man.
This post was edited on 11/1/24 at 12:04 pm
Posted on 11/1/24 at 12:09 pm to FootballFrenzy
quote:
Does snapping LSU's 104-game winning streak when up by 10+ at half and beating by them 15 points, on top of having a better non-conference loss and an undefeated SEC record, count for nothing?
Correct, none of those things matter in terms of the metrics.
#13 LSU lost to #17 USC at a neutral site by 7 (they would be projected today to win by 0.90). So they underperformed in that game by 7.9.
#16 Texas A&M lost to #6 Notre dame at home by 10 (they would be projected today to lose by 2). So they underperformed in that game by 8.0.
LSU is 3-1 vs an average ranking of #21 in SEC games. Texas A&M is 5-0 vs an average ranking of #42 in SEC games.
They're very similar. A&M won at home. Like most everyone between #5 and #16 or so the home team would likely be favored in a game between them. A&M has gotten better as the season has worn on, so they are a little bit negatively effected by an all-season rankings like this.
This post was edited on 11/1/24 at 12:11 pm
Posted on 11/1/24 at 12:11 pm to SummerOfGeorge
I changed my message, brother. My original points are irrelevant from a stats perspective, and I like having objective stuff to talk about. 
This post was edited on 11/1/24 at 12:12 pm
Posted on 11/1/24 at 12:15 pm to SummerOfGeorge
I can't remember, but did your model predict a UGA win in Austin?
Posted on 11/1/24 at 12:16 pm to Porter Osborne Jr
quote:
I can't remember, but did your model predict a UGA win in Austin?
Nope. Texas was hard to work with because they'd played absolutely nobody who could challenge them.
This post was edited on 11/1/24 at 12:17 pm
Posted on 11/1/24 at 12:17 pm to SummerOfGeorge
What's your model's record this season, just out of curiosity? I know stats rarely, rarely, are accurate.
Posted on 11/1/24 at 12:19 pm to FootballFrenzy
quote:
What's your model's record this season, just out of curiosity? I know stats rarely, rarely, are accurate.
I've tweaked it quite a bit so week 1 isn't really comparable to week 8 but overall its 50.7% overall (46.1% vs spread, 55.3% vs O/U).
Posted on 11/1/24 at 12:21 pm to SummerOfGeorge
What'd it have for these games?
UGA @ Texas
LSU @ A&M
Bama @ Tennessee
UGA @ Texas
LSU @ A&M
Bama @ Tennessee
Posted on 11/1/24 at 12:22 pm to FootballFrenzy
quote:
UGA @ Texas
LSU @ A&M
Bama @ Tennessee
Current model would have
Texas 25 - Georgia 23
Texas A&M 30 - LSU 28
Tennessee 24 - Alabama 23
Posted on 11/1/24 at 12:27 pm to SummerOfGeorge
quote:
Nope. Texas was hard to work with because they'd played absolutely nobody who could challenge them.
That makes sense. Thank you.
Posted on 11/1/24 at 12:38 pm to SummerOfGeorge
I’m not trying to be a dick because of the well thought out idea behind this model. That seems like a very low # for just getting it correct. Is that all games by SEC teams? SEC vs p4?
Posted on 11/1/24 at 12:39 pm to Farmer1906
quote:
That seems like a very low # for just getting it correct.
Yea it's been rough this year. Gotten better the last 2-3 weeks, but the start was all over the map when preseason numbers were included. Past years have been 52-54%.
quote:
Is that all games by SEC teams? SEC vs p4?
It's all games between FBS teams. 657 I think so far this season.
This post was edited on 11/1/24 at 12:40 pm
Posted on 11/1/24 at 12:46 pm to SummerOfGeorge
quote:
50.7% overall
Is the rate of predicting the winners of games? That seems almost impossibly low.
Posted on 11/1/24 at 12:47 pm to SEC Doctor
quote:
Is the rate of predicting the winners of games? That seems almost impossibly low.
Against the spread + vs the number, not straight up winner/loser.
This post was edited on 11/1/24 at 12:49 pm
Posted on 11/1/24 at 12:49 pm to SummerOfGeorge
Ohhh that’s a combo of spread and over under. Not straight up. That makes way more sense.
I think it needs to be around 52-53 to break even. It bet if you took just the top 20% of games picks where the # looked way off, you could get it up to >53% and make some money.
I think it needs to be around 52-53 to break even. It bet if you took just the top 20% of games picks where the # looked way off, you could get it up to >53% and make some money.
This post was edited on 11/1/24 at 12:51 pm
Posted on 11/1/24 at 12:50 pm to SummerOfGeorge
quote:
Against the spread + vs the number, not straight up winner/loser.
OK, that makes more sense. Wording had me confused.
Posted on 11/1/24 at 12:50 pm to Farmer1906
quote:
Ohhh that’s a combo of spread and over under. Not straight up. That makes way more sense.
Oh yea, vs the number. Straight up would be.........I dunno, something like 80-85%. Maybe more. I don't really track that.
Popular
Back to top


 2
2


